
Market session: Monday, 12 October 2026. Prepared: 13 October 2026. This is a closing-session news analysis, not a live ticker. The 13 October session was still open when this article was prepared; its intraday recovery must not be confused with Monday's red close.
Indian stock markets closed in the red on Monday, 12 October, as an early rise failed to hold. The BSE Sensex finished at 71,924.68, down 547.65 points, or 0.76%. The NSE Nifty 50 ended at 22,363.35, losing 157.10 points, or 0.70%. BusinessLine's post-close report and the separately retrieved Yahoo Finance daily index series agree on those closing levels. 1 2
For readers watching their savings or following business news, the important story is not simply that the screens turned red. It is how an initially stronger market lost momentum while oil prices, overseas investment flows and interest-rate concerns remained in focus. Banking, information technology and consumer-sector weakness featured in the session's coverage, but the market was not uniformly lower throughout the day.
This article explains the confirmed closing figures, the pressures cited in the reporting and what those developments mean in plain language. It also separates final prices from intraday snapshots. That distinction matters when a headline is shared the next morning: a report about Monday's close should not become a claim that Tuesday has already finished lower.
Key points
- Sensex closed at 71,924.68 and Nifty 50 at 22,363.35 on 12 October; both lost ground against Friday's close.
- BusinessLine linked the weakness to a fresh oil-price rise, continuing foreign outflows and higher bond yields.
- The reported ₹3,568.90 crore foreign-selling figure refers to Friday, 9 October—not Monday's final flows.
- The rupee strengthened in Monday's currency update even as the equity benchmarks fell.
- Google Trends showed interest in Sensex and related market topics, but search demand is not a prediction of market direction.
At the close: what the Sensex and Nifty figures show
Monday's decline is measured against the previous completed trading session, Friday, 9 October. The Sensex had finished Friday at 72,472.33, while the Nifty 50 had closed at 22,520.45. Subtracting those earlier readings from Monday's close produces the reported losses. The percentage change divides that difference by Friday's close, rather than by Monday's opening value. This is why the daily percentage and the opening-to-closing movement answer different questions. 2
The Nifty's finish below 22,400 makes the headline easy to understand, but that round number is not proof of a particular trading outcome. It tells readers where the index ended relative to a familiar reference point. It does not establish that the next session must decline, that every constituent has become cheaper in valuation terms, or that an index level is suitable for an individual investor. A closing number describes an event; it is not a recommendation.
Sensex and Nifty are benchmark indices, not the prices of a single company. The Nifty 50 contains 50 stocks and is calculated using a free-float market-capitalisation-weighted method, according to NSE Indices. That means constituent movements do not contribute equally. A fall in a larger-weighted company can matter more to the index than a rise in a smaller-weighted one. The benchmark can therefore weaken even while many other listed shares gain. 4
Why a positive opening did not become a positive close
An opening gain reflects the balance of buying and selling at the start of the session. It does not settle the day's result. Monday's daily index observations show the Nifty opening at 22,593.20 and the Sensex at 72,771.32, both above their Friday finishes. They later closed below those previous finishes. The change in direction is clear without inventing a minute-by-minute account of who placed which order. 2
News coverage can sound inconsistent during a reversal because different reports capture different moments. A pre-market article may discuss a positive indication. A morning report may describe an index giving up gains. A closing report may record a negative finish. All three can be accurate if their timestamps are clear. Problems arise when an opening forecast or an early quote is copied into a final recap without being updated.
BusinessLine's final report specifically described the erasure of opening gains and attributed pressure to oil, foreign fund outflows and rising yields. Those are the reported explanations for the session, not a precise accounting of each index point lost. Public reporting does not establish how much of Monday's decline came from each factor. It is more useful to understand how the pressures work than to assign unsupported percentages of blame. 1
For comparison with the previous session, Verdvit's 9 October Sensex and Nifty rebound report provides the earlier event's context. A rebound followed by a weaker session is not, on its own, evidence that either day's news was wrong. Markets continually reassess information, prices and expectations; they do not follow a straight line simply because one day finished strongly.
Why crude oil was central to the closing-day explanation
BusinessLine's post-close report cited Brent crude at $105.80 per barrel, up 1.14%, as part of the backdrop to Monday's equity weakness. That is the oil-price snapshot quoted in the report, not an independently verified futures settlement. Its relevance is the renewed pressure associated with expensive oil, rather than an assumption that the quoted price applied to every oil contract or every moment of the trading day. 1
Higher oil prices can affect businesses through fuel, transport and other input costs. A company may absorb those costs, pass some of them to customers, reduce spending elsewhere or rely on contractual protection. The result depends on the business model and the time needed for prices to change. A general oil-price rise therefore does not mean that every company's profit falls by the same amount, or that the effect appears immediately in published earnings.
The link also runs through expectations. Investors may worry about future inflation or pressure on household spending before either appears in a company's accounts. Share prices reflect views about future earnings as well as current results. That helps explain why an international commodity can influence an Indian equity session without a new domestic company announcement. It does not prove that oil was the sole cause of Monday's selling.
Oil-related headlines also need careful wording about supply. A proposal, an available reserve and a completed release are different things. Readers seeking that wider context can see Verdvit's G7 oil-reserve and IEA-plan explanation. The useful connection is the discussion of supply and policy—not an assurance that a reported reserve measure will immediately reverse oil prices or lift Indian shares.
What foreign selling explains—and what it cannot establish
The foreign-flow figure in BusinessLine's closing recap was ₹3,568.90 crore of equity selling on Friday, 9 October, attributed to exchange data. It was included as context for continuing outflow concerns. It should not be presented as the amount sold on Monday. Keeping the observation date beside the figure prevents a common error in market articles: using yesterday's available flow data as though it were today's completed activity. 1
Foreign institutional investors participate in Indian equities alongside domestic institutions, companies and individual investors. Their decisions can reflect global portfolio needs, currency exposure, valuation comparisons or changing risk preferences. A reported outflow does not reveal every institution's reasoning. It also does not prove that overseas investors have reached a shared conclusion about all Indian companies or the country's long-term growth prospects.
Net selling means the reported selling exceeded buying within the relevant category and measurement period. It does not mean nobody bought shares, nor does it show whether the activity was concentrated in a few companies. The market still clears through transactions between buyers and sellers. The information is valuable, but its scope is narrower than dramatic phrases such as “foreign investors abandon India” would suggest.
For this session, the defensible point is that recent foreign outflows were one pressure cited by the closing coverage. An exact Monday net-flow figure is not supplied here because it has not been separately established in the research used for this article. Leaving that number out is more informative than filling the gap with a different date's statistic and giving readers a false sense of precision.
How the rupee strengthened while equities still fell
A stronger currency and a weaker stock market can occur on the same day. BusinessLine's Monday update at 15:52 reported the rupee at 95.77 per US dollar, a 0.99% gain, after measures intended to temper dollar demand. The report also referred to likely intervention through dollar sales. That last explanation is reported as likely, not presented here as independently confirmed transaction-level evidence. 1
The rupee quotation needs a small clarification. When the number of rupees needed to buy one dollar falls, the rupee strengthens against that dollar. That movement can change the local-currency cost of dollar-priced purchases and the translation of overseas revenue. But different businesses have different exposures, hedges and contract terms. A currency move is not automatically good or bad for every listed company.
Equity prices respond to more than foreign exchange. Even if the currency provides some relief, investors may remain concerned about oil costs, borrowing rates, margins or the price they are paying for future earnings. The rupee's rise does not cancel those issues. Equally, the negative equity close does not prove that the currency update was inaccurate. The two markets were reporting different prices influenced by overlapping but distinct forces.
For households, the practical reading is to avoid reducing the entire market story to one variable. A stronger rupee is a relevant part of the day's news, not a guarantee about imported-goods prices or tomorrow's index. Changes in retail prices also depend on taxes, supply arrangements and business decisions. Monday's combination illustrates why a clear report should show the separate developments rather than force them into a single simplified narrative.
Why bond yields matter even if you do not own bonds
BusinessLine named rising bond yields among the factors weighing on sentiment. A yield is the return implied by a bond's price and promised payments; it is not the same as a stock dividend. Higher yields can change the relative appeal of different assets and the assumptions used to value future company earnings. The article does not quote a specific Treasury yield because no matching, timestamped closing figure has been established for this session. 1
One general valuation mechanism is discounting. Expected money received in the future is valued differently from money received today. When the required return rises, the present value of a given future cash flow can fall. That provides a reason equity investors pay attention to interest rates. It is an explanatory mechanism, not a calculation of Monday's index loss and not evidence that each company faced an identical change in its discount rate.
Borrowing conditions are another channel. Businesses with financing needs may face different costs as lending conditions change. How quickly that affects them depends on existing debt terms, refinancing schedules and cash balances. Higher benchmark yields do not establish that a particular company's interest expense rose on Monday. A market-price reaction can precede a measurable change in its accounts, or occur without one.
International rates also influence comparisons across markets. Investors assessing Indian equities may consider returns available elsewhere and the additional risks of currency exposure. Verdvit's earlier explainer on Nifty, Sensex, crude and US yields covers that broader connection. The purpose of the link is to explain the mechanism; Monday's exact close remains the distinct event discussed here.
Why banking stocks can have an outsized effect on the headline
Banking weakness featured prominently in Monday's intraday reporting. Moneycontrol's 11:25 snapshot described the PSU Bank index as down 1.21% and Bank Nifty as down 0.82%. Those are morning readings, not the sector indices' final closes. They help explain how the market was behaving during the reversal, but should not be used to claim that those exact losses held through the closing bell. 3
Banks can be important to an equity benchmark because index weights are unequal. When financial constituents weaken, the effect on the headline may differ from a similarly sized percentage move in a smaller-weighted sector. Understanding that construction helps a reader distinguish an index-heavy decline from a market in which almost every listed share falls. Neither description should be assumed from the red colour of the benchmark alone.
Bank earnings themselves depend on several moving parts, including lending, funding costs, fee income and credit quality. An interest-rate change can have competing effects rather than a simple one-way outcome. This article does not infer a new deterioration in any bank's loan book or give a target for its shares. A daily price change is not a substitute for the company's financial disclosures.
Google Trends also displayed a related search cluster about bank-stock selling pressure during the observed period. That shows audience interest in an explanation, not proof of a new company-specific problem. Search behaviour can follow a price move or an existing news report. The event should be established from financial reporting first; Trends is useful for identifying the questions readers are asking afterward. 6
The session was not equally weak across every sector
BusinessLine's final summary named ITC, Tech Mahindra, Hindustan Unilever, Larsen & Toubro, State Bank of India and Tata Consultancy Services among the Sensex laggards. It identified Bharat Electronics, Mahindra & Mahindra, Kotak Mahindra Bank and HCL Tech among the winners. These names describe participation in the session; they are not a list of stocks to buy or sell, and no individual share-price targets are attached. 1
The contrast matters because a falling index often gets described as though all businesses suffered the same setback. The final report's winners show that was not the case. However, a list of winners also does not establish that the broader economy improved or that those companies will keep outperforming. Daily market performance and a business's operating health are related questions, not interchangeable measurements.
Sector differences can reflect varying exposures to oil, rates, currencies and company-specific news. That is a general framework for reading the session, not a claim that a single verified event explains every named stock's movement. Without a supporting filing or a clearly attributed company announcement, it would be misleading to invent an earnings surprise, an order win or an institutional transaction to explain a price change.
For readers interested in market news rather than trading calls, this is where selective detail helps. The useful question is whether the weakness was concentrated, broadening or offset elsewhere. A long list of unverified stock figures would make the report harder to follow. The confirmed closing recap gives enough examples to show the mixed participation without presenting a speculative explanation for each company.
Why market breadth can disagree with a red benchmark
Market breadth usually describes how many securities advance or decline, rather than the size of each company's index weight. Moneycontrol's 11:25 Monday snapshot reported 2,157 advances against 1,652 declines even as Sensex and Nifty traded lower. Its same report described smallcaps rising 1.27% and midcaps gaining 0.13%. These figures belong to that morning snapshot; this article does not label them as the day's final breadth or closing returns. 3
That observation is not a contradiction. A simple count gives one advancing company one place in the tally, whatever its size. A capitalisation-weighted benchmark assigns a different influence to its constituents. Enough smaller shares can rise to produce positive breadth while weakness in heavily weighted companies pulls a benchmark down. The relevant measurements answer different questions about the same market.
Breadth also changes during a session. A positive morning tally does not prove that the entire day remained positive below the surface. To make that stronger claim, a closing tally with a clearly identified universe would be needed. The safe conclusion from the acquired report is narrower: there was an observed point during Monday's decline when broader participation was better than the headline indices suggested.
An individual portfolio can therefore perform differently from Sensex or Nifty. Its holdings, weights, cash position and costs may not match either benchmark. That does not make the benchmark useless. It means a reader should understand what the benchmark measures before using it as an exact description of a personal account, a mutual fund or the experience of every market participant.
What the recent closing sequence adds to the story
The retrieved Nifty daily series records completed closes of 22,603.05 on 7 October, 22,231.80 on 8 October, 22,520.45 on 9 October and 22,363.35 on 12 October. The sequence shows a decline, a rebound and another decline. It is short-term context only, not a statistical model or evidence that the market must repeat the pattern. No partly completed 13 October observation appears in this closing chart. 2
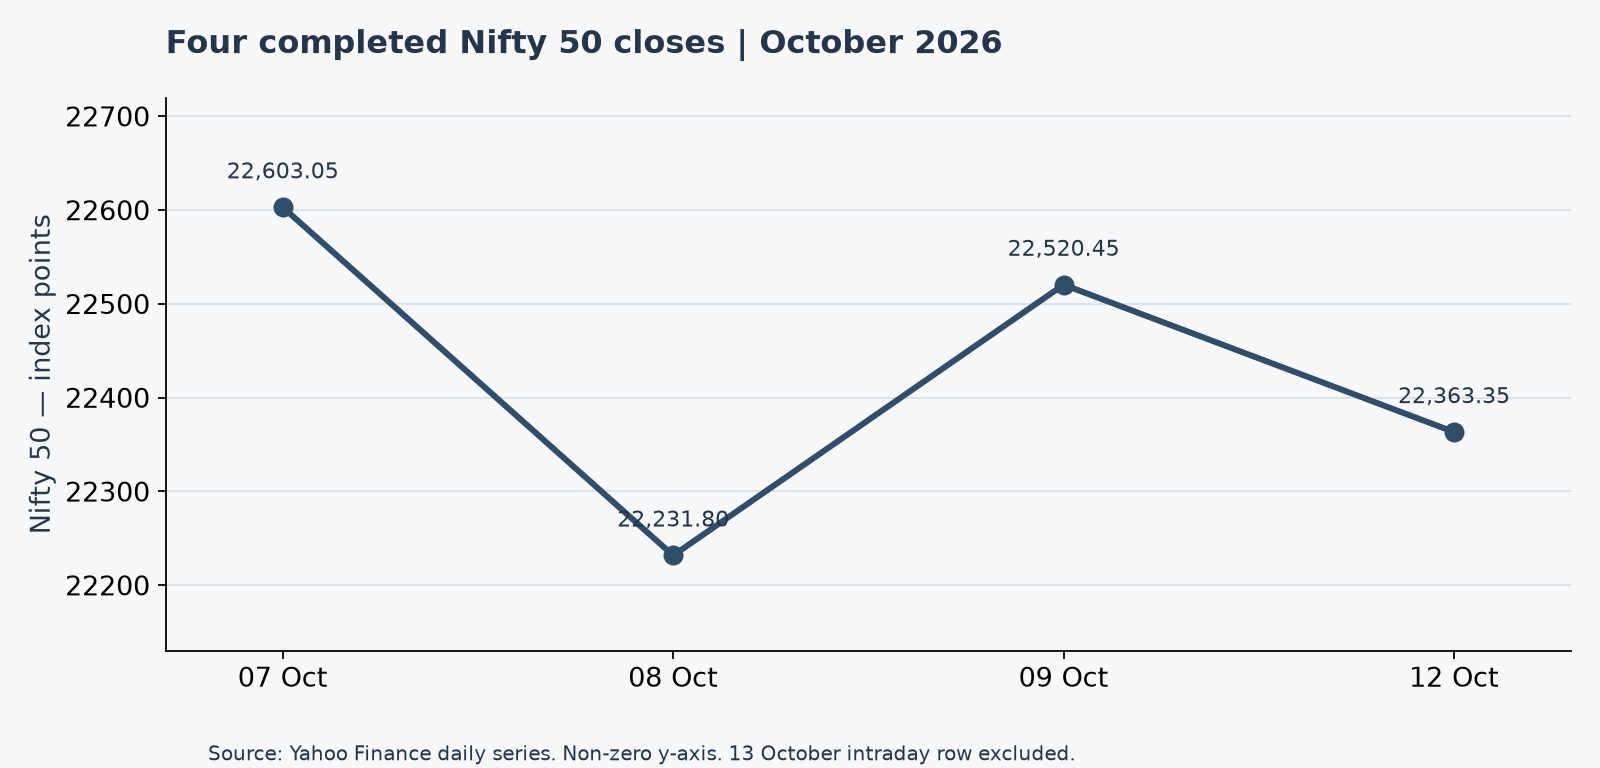
Source: Yahoo Finance daily index data. Four completed sessions only. The non-zero vertical axis highlights changes within this short period; it does not represent a fall to zero.
The previous rebound supplies a useful comparison for Monday's loss. It prevents the report from treating one red session as an isolated event with no recent context. At the same time, four observations are not enough to establish a durable trend or estimate the likelihood of the next move. A short chart should not be presented as a trading system simply because it looks visually clear.
The differences between closing prices are not the same as a complete investor return. An index level tracks the benchmark's specified calculation. A product following that benchmark may involve expenses, tracking differences and distributions. A personal result also depends on entry dates and transactions. Those distinctions keep the chart focused on its real purpose: showing the dated sequence of reported market closes.
What Google Trends showed about market-related interest
A direct check of Google Trends' India “Business and Finance” view, covering the past 24 hours, displayed “sensex index” at 2K+ searches with a 75% rise. The status was “Lasted,” not “Active,” when checked. The cluster's related terms included “sensex moneycontrol” and “sensex share bazar.” That provides evidence of interest in benchmark information without claiming that the exact headline of this article was itself a trending query. 6
The same view displayed “investing” at 1K+ searches and a 100% rise, with “sensex nifty stock market” among its related queries. “Brent crude oil price” appeared at 200+ and “usd inr” at 500+, each with a displayed rise. These are Google's visible query-cluster bands, not exact monthly search volumes or a count of unique people. A related query does not acquire a separate volume estimate just because it appears in the cluster. 6
The editorial value is straightforward: readers were looking for benchmark, oil and currency explanations, so the article addresses those topics in connected sections. It does not insert every trending business term into the headline. Unrelated popular searches would make the story less useful. Natural language and accurate context are more valuable to the reader than a block of repeated market phrases.
Search interest cannot confirm why investors traded, how many people lost money or what the next close will be. A rise in queries may reflect curiosity, concern, a newly circulating headline or a search for basic definitions. It is therefore used here to understand audience questions. The financial event itself is verified separately through the closing report and the dated index observations.
What volatility tells us without forecasting the next move
India VIX offers a different perspective from Sensex and Nifty. NSE defines it as a volatility index derived from Nifty option prices that reflects expected volatility over the next 30 calendar days, expressed as an annualised percentage. It is not a promise about where the Nifty will be after 30 days. Expectations of larger movement can involve uncertainty in either direction. 5
Moneycontrol's 11:25 snapshot described India VIX as up 7.09%. That was an intraday change in the volatility index, not a statement that the Nifty was expected to lose 7.09%, and not a verified final VIX reading. Keeping those concepts separate is important. A percentage change in a volatility gauge and a percentage change in a stock index measure different things. 3
For a reader, a higher volatility expectation can explain why the session feels less settled even when the benchmark's final percentage decline is below one percent. Larger perceived uncertainty may affect the prices of protection and the willingness to hold exposure. But this article does not infer the exact positioning of traders from VIX alone. The options-derived gauge is evidence about pricing expectations, not a complete inventory of market motives.
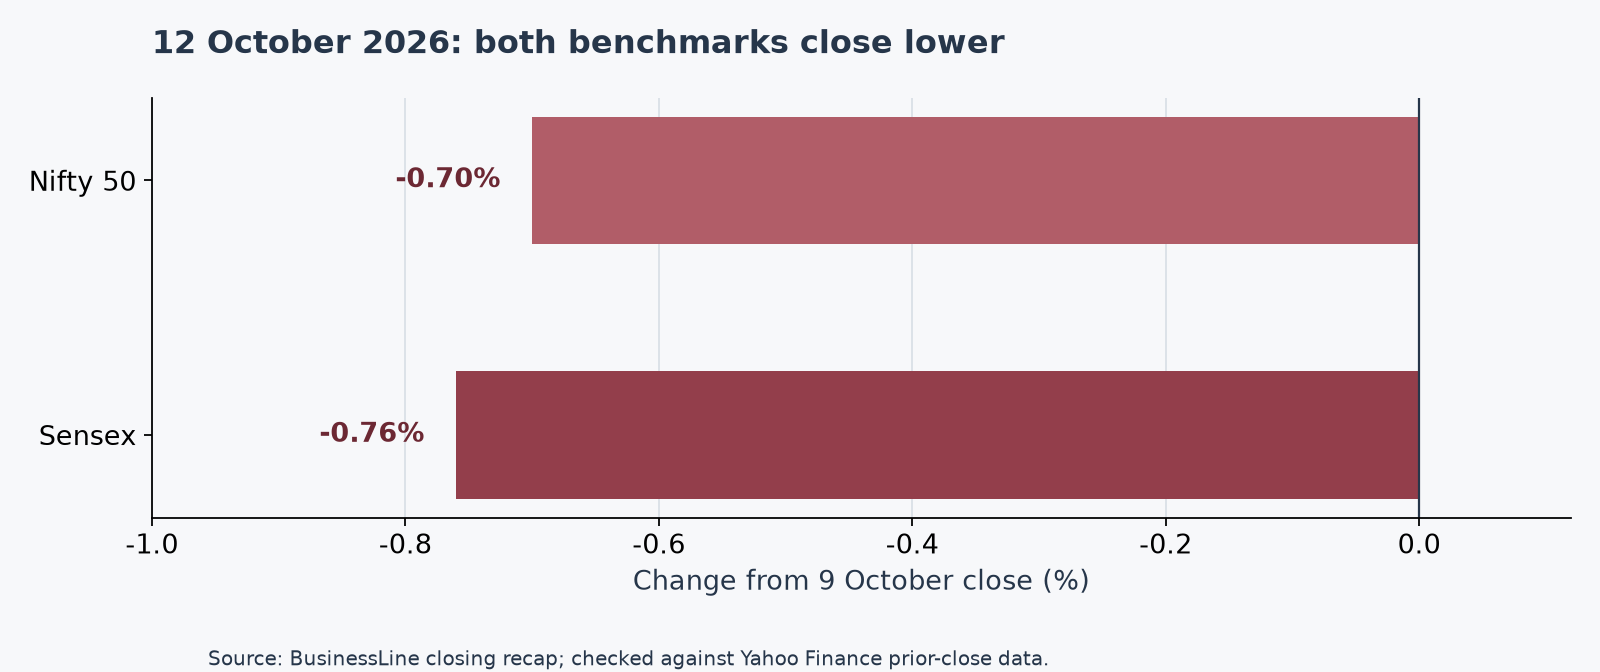
Source: BusinessLine final recap; percentage changes cross-checked against the previous closes in the Yahoo Finance series. These are equity-index returns for the session, not VIX readings.
Earnings headlines need their own dates and evidence
A market-wide recap can provide useful background for earnings news, but it should not pretend every company report was available before Monday's close. Investors may trade ahead of results because they have expectations. Those expectations remain different from the actual figures later disclosed by the company. A post-close result cannot simply be moved backward in time and declared the confirmed cause of an earlier index change.
The importance of chronology is visible in Tuesday's reporting. A Kotak Neo update published on 13 October at 10:49 described an early equity recovery and showed IT-sector strength in its morning snapshot. That was a new session and a new observation. It is included here only to prevent Monday's negative closing headline from being read as a claim about Tuesday's completed performance. 7
When reading a company result, the useful distinctions are the reporting period, whether the numbers are actual or forecast, and whether commentary is management guidance or an analyst interpretation. A fiscal quarter and the calendar publication date are not necessarily the same period. Those labels matter more than a dramatic summary saying a result was “good” or “bad.” This article does not add unverified company earnings figures to lengthen the market recap.
Global earnings news also requires geographical care. A development affecting a US technology company may be relevant to wider sentiment without being the direct cause of an Indian stock's move. Verdvit's Micron and Nasdaq news report offers a separate example of that international coverage. It should be read as its own sourced event, not as a substitute for evidence about Monday's Indian close.
Why global market timing can confuse an Indian recap
Indian and US trading sessions do not finish together. An Indian closing article published in the afternoon can refer to the previous completed US session or to current futures, but a US cash-market close that happens afterward is not yet known. This basic timing point prevents later global news from being incorrectly presented as information Indian investors already had during Monday's trading.
Futures are also different from completed cash-index prices. A futures indication can change before the underlying market opens, and it does not guarantee the opening or final return of the cash index. The same caution applies to pre-market indications for Indian equities. A strong early signal and a negative final close do not conflict when the measurements refer to different instruments and times.
Economic releases must be handled with the same care. A scheduled release is an upcoming event until the actual report appears. A forecast is not the released figure, and an initial estimate can later be revised. Verdvit's September US payrolls and revisions explainer explains one such distinction. It is background reading rather than a claim that the report alone determined Monday's session.
What a red close means for households following their savings
A lower index close can be worrying, especially for someone who has recently started following investments. The first useful distinction is between a benchmark move and a personal account's actual result. The Sensex's decline describes its constituents under its calculation method. It does not tell a reader the exact change in every fund, retirement holding or savings product, and it does not mean an index-point loss is a rupee loss per investor.
A change in market value is also different from a completed sale. A holding's displayed value may fall while it remains in the account. Selling converts that holding into a transaction with its own price and costs. That distinction does not make the decline harmless; it simply prevents the language of a daily news recap from confusing a valuation change with an identical realised loss for every participant.
Household planning has other considerations that this article cannot know, including income stability, cash needs, existing borrowing and tolerance for uncertainty. A broad news report therefore cannot responsibly tell everyone to buy a dip, exit the market or stop a contribution. Those would be individual decisions rather than conclusions supported by Monday's closing figures. Readers needing personal guidance should distinguish regulated advice from a general market explanation.
Why mutual-fund performance may differ from the benchmark
A mutual fund's result depends on what it holds and the rules under which it operates. A fund concentrated in particular sectors may behave differently from a broad large-company index. Even a product designed to follow an index can differ because of expenses, cash holdings or tracking effects. Monday's Sensex and Nifty changes therefore cannot be copied directly as the day's return for every equity fund.
There is also a distinction between a market quote and a fund's reported net asset value. The latter follows the fund's valuation process and reflects the relevant assets and liabilities. It is not the same as a live intraday index reading. A screenshot of the Nifty in the morning should not be presented as the confirmed final value of a fund unit. Clear reporting identifies which figure is being discussed.
Regular contributions do not remove market risk. Equally, a red closing session does not by itself establish that a contribution arrangement has failed. The effect on a particular saver depends on the product, transaction timing and goals. This article does not recommend starting, stopping or changing a systematic plan, and it does not claim that any method guarantees a positive outcome.
Why borrowing and derivatives change the risk question
A daily decline below one percent can have very different implications for someone holding an unleveraged asset and someone exposed through borrowing or derivatives. Leverage changes how a movement in the underlying market affects the capital committed to a position. The headline percentage is therefore not a complete description of every participant's risk, even when it is accurately reported.
Options introduce additional variables, including time to expiry and the pricing of expected volatility. An option's price need not move in the same proportion as the underlying index. A statement that the Nifty lost 0.70% cannot establish the return on an unspecified options position. The position's contract terms and pricing conditions would need to be known. No hypothetical derivative profit or loss is calculated in this article.
Borrowing can also create obligations that remain when market prices move against a participant. That is one reason dramatic claims of easy recovery are misleading. A later rebound does not automatically repair every prior position or erase transaction costs and financing consequences. Understanding the instrument is a separate requirement from understanding the day’s news.
What remains uncertain about the session
The final benchmark levels are confirmed, but the research does not establish a separately verified Monday institutional-flow total or the precise contribution of each reported pressure. The Friday flow number and the morning breadth and volatility readings remain explicitly dated in the sections above. They must not be mistaken for additional Monday closing statistics.
The subsequent 13 October recovery is a morning observation, not a completed-session result. This analysis describes the 12 October close; any later closing report needs its own evidence and date. 1 3 7
What to monitor next after this close
The next relevant developments are new, timestamped facts: completed-session index prices, appropriately dated institutional flows, company disclosures and economic releases. Their value is in showing what changed after Monday. A newer article should not merely repeat this close under a different date, and a partial Tuesday quote should retain its “intraday” label until the session is complete.
For oil and currencies, the contract or quotation basis matters as well as the date. A spot quotation, a futures price and a settlement can differ. A fresh report should identify which one it uses before comparing it with Monday's cited snapshot. That prevents a routine difference in quotation basis from being misreported as a sudden economic shock.
Policy headlines also deserve a direct reading of the actual decision and its effective terms. Verdvit's October RBI policy coverage provides related domestic context. The link does not establish that a new policy change occurred on Monday, and this article does not announce a fresh repo-rate decision without a corresponding source.
Frequently asked questions
Why did Indian stock markets close in the red on 12 October?
BusinessLine attributed the pressure to a fresh rise in crude oil, continuing foreign fund outflows and higher bond yields. The benchmarks erased opening gains. Those are the drivers cited in the report; the research does not establish a precise contribution from each one. 1
What were the final Sensex and Nifty levels?
Sensex closed at 71,924.68, down 547.65 points or 0.76%. Nifty 50 finished at 22,363.35, down 157.10 points or 0.70%. Both changes are measured against the previous completed session on 9 October. 1 2
Did the 13 October market also close in the red?
That could not be established when this article was prepared because the 13 October session was still open. The available morning report described a recovery. An intraday recovery is not a final close, just as Monday's negative finish is not a forecast of Tuesday's result. 7
Does Google Trends show how many investors lost money?
No. Google Trends reports search interest, including query-cluster volume bands and changes. It does not identify investment positions, account returns or realised losses. The observed Sensex-related interest helped identify reader questions, not measure the financial outcome of market participants. 6
Does this article recommend buying or selling?
No. This is a dated news analysis and explanation of market concepts. It contains no personalised investment advice, individual trading recommendations or promised returns. The confirmed closing figures describe what happened; they do not establish what an individual should do next.
This is research and analysis only, not personalized financial advice.
Article details
SEO title: Indian Markets Close Red: Sensex Falls, Nifty Below 22,400
Meta description: Indian markets closed lower on 12 October: Sensex fell 547.65 points and Nifty ended at 22,363.35. Read the oil, flow and rupee context.
Topic tags: Indian stock market, Sensex, Nifty 50, market closing report, crude oil, institutional flows, rupee, financial education.
Quick answer: Indian stocks closed lower on 12 October 2026. Sensex ended at 71,924.68, down 0.76%, while Nifty 50 closed at 22,363.35, down 0.70%. Closing coverage cited oil prices, foreign outflows and rising bond yields.